
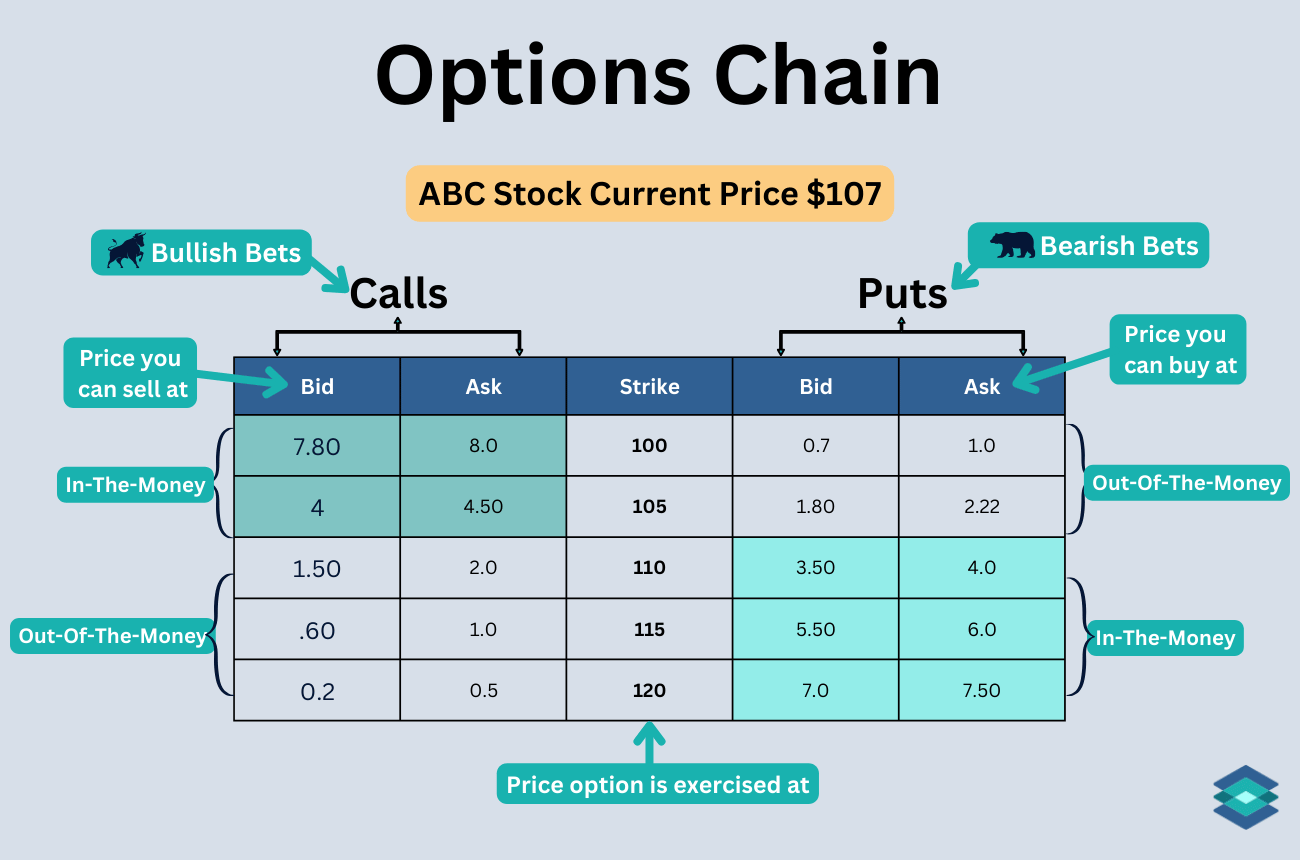
Ever felt like you’re staring at a tangled mess of numbers and letters on your trading screen, wondering if it’s some secret code only Wall Street wizards can crack? That’s exactly how I felt when I first dove into options chain analysis—overwhelmed, a bit frustrated, and honestly, craving a simple guide to make sense of it all. But hey, after some trial and error (and a few late-night coffee-fueled sessions), I’ve simplified it into something anyone can grasp. Today, we’re chatting about options chain analysis in a laid-back way, stripping away the jargon to help you trade smarter, not harder.
If you’re asking, “How can I simplify options chain analysis for better trading decisions?”—well, it’s all about focusing on the essentials without getting lost in the noise. Start by looking at the bid and ask prices, strike prices, and volume to spot opportunities quickly. This approach cuts through complexity, letting you identify profitable trades with confidence in just a few glances. Mastering this can turn your trading game from guesswork into a strategic edge.
Let’s kick things off by getting cozy with what an options chain really is. Picture it like a menu at your favorite diner—it’s a list of all available options for a particular stock, showing calls and puts at various strike prices. Options chain analysis is your way of scanning that menu to pick the best dish based on your appetite for risk and reward. I remember my first time; I was glued to my screen, treating it like a puzzle game, and once I connected the dots, trading felt less like a chore and more like a fun strategy session.
The Building Blocks of an Options Chain
Diving deeper, every options chain has key elements that tell a story about market sentiment. You’ve got the strike price, which is basically the level where the option could turn profitable—think of it as the finish line in a race. Then there’s implied volatility, that sneaky factor showing how much the stock might swing, like predicting if your weekend plans will be sunny or stormy. And don’t overlook the Greeks, those Greek letters that sound fancy but are just tools to measure risk, like delta for directional bets or theta for time decay.
Hedging Methods for Portfolio ProtectionIn a relaxed vibe, imagine you’re at a casual gathering with trader friends, sharing tips over coffee. One might say, “Hey, check the open interest; it’s like seeing how crowded the party is.” That’s spot-on—high open interest often signals strong trader interest, hinting at potential price moves. By mixing in these details, options trading guides become less intimidating and more like swapping stories that build your confidence.
Spotting Patterns and Making Smarter Moves
Now, let’s talk about the fun part: actually analyzing that chain. Start by comparing call and put options at different strikes. For instance, if calls are pricier than puts, it might mean the market’s bullish, like everyone’s betting on an upward trend. I once caught a breakout by noticing unusual volume spikes—turned a small position into a decent win. It’s those “aha” moments that make trading addictive.
To keep it varied, let’s throw in a quick table for visual folks. Here’s a simple comparison of call versus put options, because who doesn’t love a side-by-side glance?
| Feature | Call Options | Put Options |
|---|---|---|
| What it represents | Right to buy the stock | Right to sell the stock |
| Ideal when | Expecting price rise | Anticipating price fall |
| Risk profile | Unlimited upside, limited downside | Limited upside, potentially large downside |
This breakdown shows how options chain analysis helps you weigh pros and cons, almost like choosing between hiking up a mountain or chilling by the lake—both can be rewarding, but it depends on your mood.
Day Trading Psychology TipsStep-by-Step: Your Easy Analysis Routine
Alright, let’s walk through a straightforward process. First, pull up the options chain for your stock of interest—most platforms make this a breeze.
1Scan for the expiration dates that align with your timeline; short-term if you’re playing quick moves, longer if you’re in for the long haul.
2Check the bid-ask spread; a tight one means easy trading, while a wide gap might signal illiquidity—avoid those like skipping a rainy day outing.
3Dive into volume and open interest to gauge popularity; high numbers often mean reliable price signals, much like following a trending meme on social media.
Automated Systems for Efficient TradingThis routine keeps things flowing without overwhelming you, turning trading guides into practical tools for everyday use.
Wrapping Up with Real-World Wisdom
As we ease out of this chat, think about how options chain analysis isn’t just numbers—it’s a window into market vibes that can sharpen your instincts. Maybe you’ll recall that time a viral stock tip on Reddit lined up with chain patterns, leading to a smart trade. Or perhaps you’ll craft your own strategy, blending this with personal insights. Either way, why not dive in and experiment? Your next big trading win might be just a simplified chain away, ready to turn curiosity into cash.
Quick FAQ
What is the most important thing to watch in an options chain? Honestly, it’s implied volatility—it tells you how much wiggle room the stock has, helping predict big moves without overcomplicating things.
How often should I check the options chain? Daily if you’re active, but at least weekly to stay ahead; it’s like checking the weather app before plans, keeping you prepared for shifts.
Swing vs Scalping Approach DifferencesCan beginners really master this? Absolutely, with practice and resources like these guides; start small, learn from each trade, and it’ll click faster than you think.