
Picture this: I’m sitting at my desk, coffee in hand, staring at a screen full of squiggly lines that look more like modern art than a roadmap to profits. That’s how trading felt for me at first—overwhelming, like trying to read tea leaves in a storm. But then I discovered technical indicators, and suddenly, those lines started whispering secrets about market trends. If you’re diving into trading guides, knowing these tools can turn guesswork into smarter moves. Let’s chat about how they can level up your trades in a relaxed way, no pressure.
Technical indicators are essentially the crystal balls of trading, helping you predict price movements based on historical data and patterns. In simple terms, they analyze charts to spot trends, momentum, and potential reversals, making your decisions less of a shot in the dark. For anyone aiming for better trades, mastering a few key ones can boost your confidence and results—think of it as adding a reliable co-pilot to your trading journey. This approach has personally helped me avoid knee-jerk reactions during volatile markets, turning potential losses into learning moments.
Why Bother with Technical Indicators in Your Trading Routine?
Okay, let’s get real—trading isn’t just about luck or watching the news. It’s about patterns, and technical indicators are like the highlighters in your toolkit. They take raw price data and crunch it into visuals that even a newbie can grasp. I remember my first big win: using a simple moving average to confirm a trend, which saved me from bailing too early on a stock. Stuff like that keeps you engaged without the constant stress. For trading guides enthusiasts, these indicators add that extra layer of insight, making your strategy feel more personal and less robotic.
From a broader view, indicators help in various market scenarios, whether you’re into stocks, forex, or crypto. They’re not foolproof—nothing in trading is—but they reduce emotional fog. Imagine spotting overbought conditions with the RSI before the crowd does; it’s like having insider info without the sketchy vibes. And hey, in our digital age, with memes flying around about “diamond hands” holders, using tools like these keeps you in the loop, blending old-school analysis with modern trading culture.
Commodity Trading Opportunities ExploredExploring Popular Technical Indicators for Everyday Trades
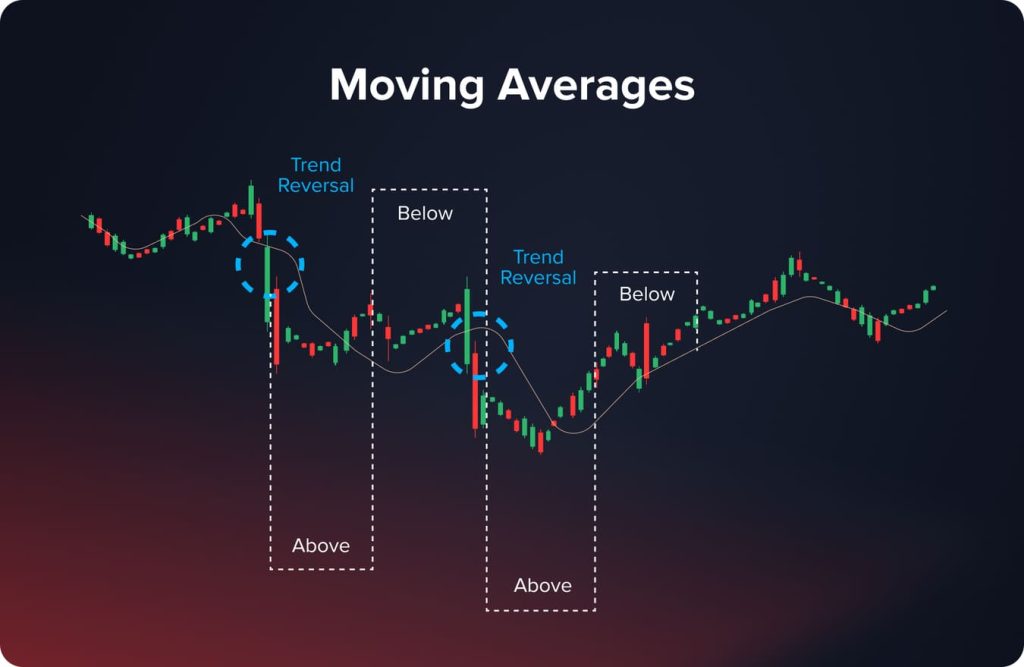
Diving deeper, let’s break down some favorites that I’ve tinkered with over time. First up, the moving average—it’s like the gentle giant of indicators. This one smooths out price data to show the overall direction, helping you decide if it’s time to buy or sell. For instance, when the price crosses above a 50-day moving average, it might signal an upward trend, which has been a game-changer for my short-term plays.
Then there’s the Relative Strength Index (RSI), which measures momentum on a scale of 0 to 100. If it hits above 70, things might be overbought, hinting at a pullback—perfect for those “wait a sec” moments. I once used RSI to sidestep a crypto dip, turning what could have been a loss into a breakeven story. Oh, and don’t overlook the MACD; it’s like a high-five between two moving averages, flagging potential shifts with crossovers. These aren’t just numbers; they’re your trading buddies, adapting to whether you’re day trading or holding long-term.
| Indicator | What It Does | Best For |
|---|---|---|
| Moving Average | Smooths price trends to identify direction | Trend following in stocks or forex |
| RSI | Detects overbought or oversold conditions | Momentum trading in volatile markets |
| MACD | Shows convergence and divergence for signals | Timing entries and exits in any asset |
To make this practical, let’s walk through applying these. 1Start by picking a chart and overlaying your chosen indicator, like adding a moving average to a daily stock graph. 2Watch for signals, such as a crossover, and cross-reference with other data to avoid false alarms. 3Fine-tune based on your style; I always adjust periods for shorter trades to keep things nimble.
Common Pitfalls and How to Dodge Them for Smarter Trading
Alright, no guide is complete without the bumps in the road. One big mistake? Relying solely on one indicator, like treating RSI as your crystal ball. That led me to a few unnecessary exits early on—lesson learned, mix it up for a fuller picture. In trading guides, it’s all about balance; use indicators as guides, not gospel, especially in fast-paced environments like options trading.
Options Chain Analysis SimplifiedAnother trap is ignoring market context—remember, indicators don’t predict news events or economic shifts. Think of them as weather apps; they tell you it’s rainy, but not if a storm’s brewing elsewhere. To keep it light, I’ve started journaling my trades, noting how indicators played out, which adds a personal touch and helps refine my approach over time.
Wrapping Up with a Fresh Take on Your Trading Path
As we ease out of this chat, consider how these indicators could reshape your next trade, maybe even spark that “aha” moment like it did for me during a quiet Sunday analysis session. What if you experimented with a new one today, seeing where it leads? It’s not about perfection; it’s about evolving your game with a bit of curiosity and less rigidity.
FAQs on Technical Indicators
What’s the best indicator for beginners? For starters, go with a simple moving average—it’s straightforward and helps build confidence without overwhelming you with complex calculations.
How often should I check these indicators? It depends on your style, but daily reviews work for most; I peek in a few times a week to keep things relaxed and avoid burnout.
Hedging Methods for Portfolio ProtectionCan indicators guarantee profits? Not really—they’re tools, not magic wands, so always combine them with risk management for a more grounded trading experience.