
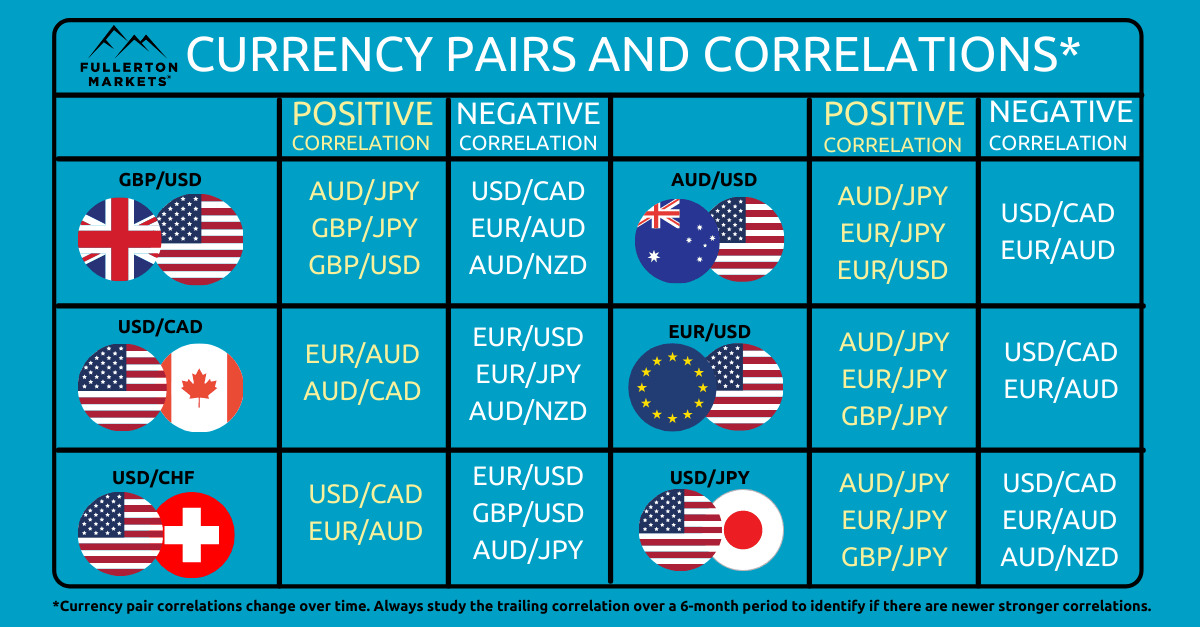
Ever had that moment in trading where you thought you were diversifying your portfolio, only to watch everything tank together like a group of friends ditching a bad party? Yeah, that’s the sneaky world of Forex currency pair correlations at play. I’m no wizard, but after years of staring at charts and learning the hard way, I’ve come to see these correlations as the unsung heroes—or villains—of the trading game. Let’s kick back and unpack this, shall we, without all the stiff jargon?
Picture this: you’re trading EUR/USD, thinking it’s cruising along fine, but then GBP/USD starts mirroring it like an echo in a canyon. Forex currency pair correlations are basically how different currency pairs move in relation to each other, and understanding them can be your secret weapon in the trading arena. It’s not just about numbers; it’s about spotting patterns that could save your skin during volatile markets. For instance, if you’re holding positions in correlated pairs without realizing it, you might be amplifying risks instead of spreading them out.
In a nutshell, correlations measure the statistical relationship between two assets. A positive correlation means they generally move in the same direction—like EUR/USD and GBP/USD, both often reacting to European economic news. On the flip side, a negative correlation, such as USD/JPY and gold prices, might see one rise while the other falls. Why does this matter? Well, as someone who’s nursed a coffee-fueled all-nighter after a bad trade, I can tell you it helps avoid that gut-wrenching surprise when your “diversified” strategy blows up because everything was tied together. Using Forex currency pair correlations isn’t just smart; it’s like having a backstage pass to the market’s rhythm.
The Basics of Currency Pair Correlations
Alright, let’s dive deeper without getting too textbook-y. Imagine correlations as the friendships in a high school clique—some pairs are BFFs, always in sync, while others are total opposites. In Forex, we quantify this with a correlation coefficient, ranging from -1 to +1. A coefficient near +1 means strong positive correlation, like AUD/USD and NZD/USD, both influenced by commodity prices and Pacific economies. Near -1? That’s negative, such as EUR/USD and USD/CHF, where one might zig while the other zags.
Building Wealth through Trading DiversificationI remember my first big trade mishap; I was juggling multiple pairs without checking their correlations, and boom, a single economic report sent them all south. It’s a humbling lesson that correlations aren’t static—they fluctuate with market conditions, geopolitical events, or even central bank decisions. Tools like MetaTrader or Excel can help you calculate these on the fly, using historical data to spot trends. And here’s a pro tip: keep an eye on the 1-month, 3-month, and 1-year correlations for a fuller picture, as short-term vibes can differ wildly from long-term buddies.
Why Correlations Are a Trader’s Best Friend
Now, why bother with all this? In the relaxed flow of trading, Forex trading correlations act as your risk management sidekick. If you’re long on positively correlated pairs, you’re essentially doubling down on the same bet, which can be thrilling but risky—like betting on both teams in a tie. Conversely, negative correlations let you hedge, balancing potential losses. Think of it as that friend who always brings the calm when you’re freaking out.
Anecdotally, I once turned a losing streak around by analyzing correlations during a volatile week. EUR/USD was dropping with GBP/USD, but I spotted USD/CAD moving oppositely and adjusted my positions. It’s not magic; it’s about that “aha” moment when you connect the dots. For newbie traders, this means building strategies that incorporate correlations for better diversification, reducing the chance of a portfolio wipeout. And let’s not forget cultural nods—much like how memes spread on social media, market correlations can “go viral” based on global events, so staying tuned to world news is key.
Practical Ways to Use Correlations in Your Trading
Okay, enough theory—let’s get practical. First off, start by listing out major pairs and their typical correlations. For example, here’s a quick table to visualize some common ones, based on average market behaviors:
Margin Trading Pros and Cons| Currency Pair 1 | Currency Pair 2 | Typical Correlation | Why It Matters |
|---|---|---|---|
| EUR/USD | GBP/USD | High Positive (+0.8 to +0.9) | Both react to Eurozone and UK news, great for spotting trends. |
| USD/JPY | Gold (XAU/USD) | High Negative (-0.7 to -0.8) | When USD strengthens, gold often weakens, ideal for hedging. |
| AUD/USD | NZD/USD | Strong Positive (+0.6 to +0.7) | Commodity-driven economies mean they move together often. |
If you’re stepping into strategies, consider this:
1Identify your current holdings and check their correlations using a reliable calculator.
2Adjust your portfolio to include negatively correlated pairs for balance.
3Monitor changes weekly, as correlations can shift like sand in the wind.
Algorithmic Backtesting for StrategiesWrapping up this chat, correlations aren’t just data points; they’re the heartbeat of informed trading decisions. Ever wondered how pros stay ahead? It’s often by mastering these invisible threads. So, what’s your next move—dive into some charts or rethink that strategy?
FAQ: Quick Hits on Correlations
What is a positive correlation in Forex? It’s when two currency pairs tend to move in the same direction, like EUR/USD and CAD/USD during commodity booms, helping traders amplify gains but also risks if not managed.
How can I calculate correlations myself? Use tools in platforms like TradingView or Excel with historical price data; it’s as straightforward as plotting a simple formula to see how pairs dance together over time.
Are correlations always reliable? Not entirely—they can change with market shifts, so treat them as guides, not gospel, to keep your trading approach flexible and adaptive.
High-Frequency Trading Insights